
Vibe Coding the Las Vegas Market: The January Shift
Alright, let’s cut to the chase—the ‘New Year’ honeymoon phase is officially over and the real work has begun. 💼 While everyone else was busy making resolutions they’ve already forgotten, the Las Vegas market was busy rewriting the rules for 2026. If you’ve been sitting on the sidelines waiting for ‘the right time,’ I hope you’re paying attention, because the vibe just shifted in a big way. ✨
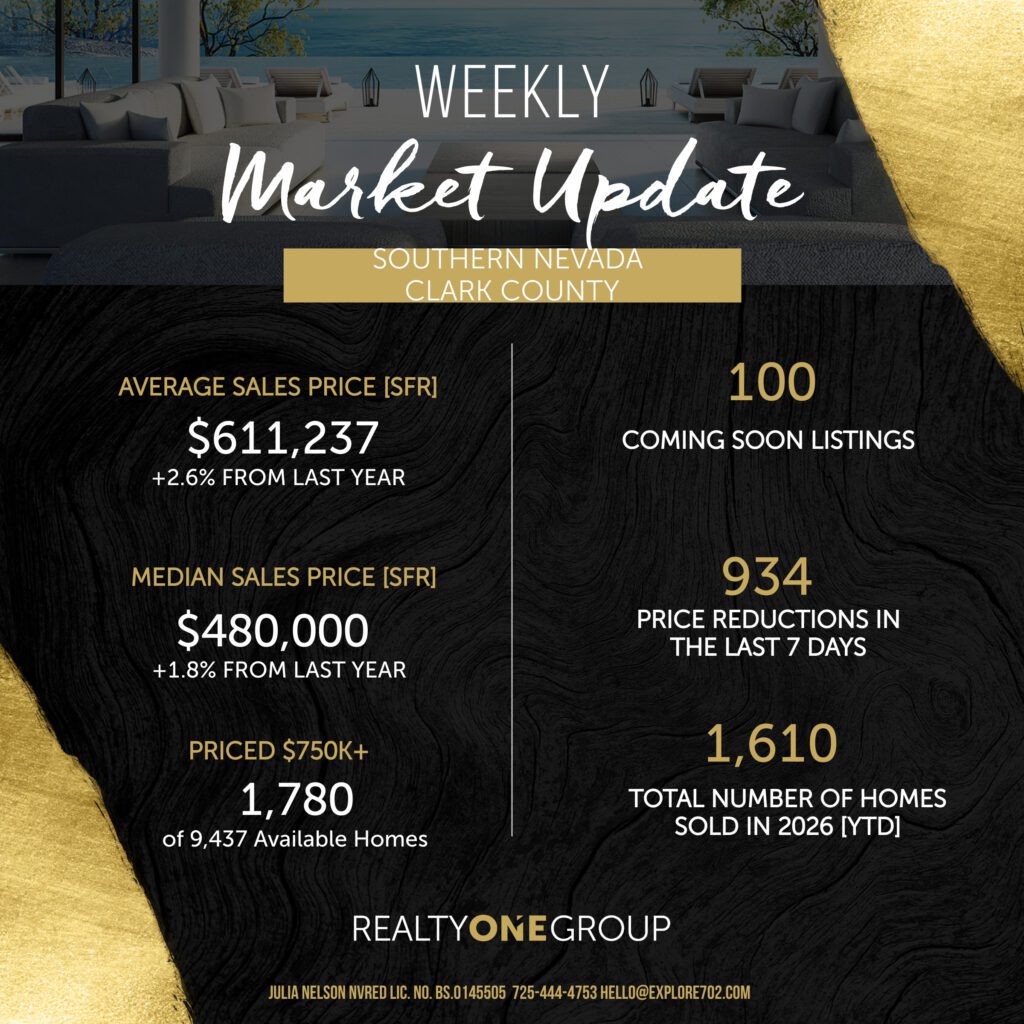
I’m not here to give you the same recycled advice you’re hearing everywhere else. I’ve got the receipts, and they’re showing a market that is moving with calculated precision. We are closing out January with a massive 1,087 new listings hitting the streets in just the last seven days—that is the inventory surge we’ve all been waiting for.
Combine that with 934 fresh price reductions, and the ball isn’t just in your court; it’s practically in your hands. Whether you’re looking to dodge the ‘rent trap’ or finally trade up to that forever home, this ‘January Shift’ is your strategic window before the Spring competition wakes up and starts a bidding war. No more guessing—let’s decode exactly what these numbers mean for your equity. Scroll down for the breakdown! 👇
RESIDENTIAL AVERAGE PRICE
Rolling 12-month period, along with percentage increase or decrease from the previous year.-
$595,646 Last Year
-
2.6% Increase
RESIDENTIAL HOMES SOLD
Rolling 12-month period, along with percentage increase or decrease from the previous year.-
33,289 Last Year
-
-7.1% Decrease
CURRENT NUMBER OF
RESIDENTIAL OFFERINGS AVAILABLE NOW
RESIDENTIAL MEDIAN PRICE
Rolling 12-month period, along with percentage increase or decrease from the previous year.-
$471,446 Last Year
-
1.8% Increase
-
Las Vegas Single Family Residences 4,088
-
Henderson Single Family Residences 1,306
-
North Las Vegas Single Family Residences 649
-
Condos 1,396
-
Townhomes 1,104
-
Manufactured Homes 305
-
Coming Soon Listings 100
-
Total Under Contract 2,715
-
Total REO/Bank Owned 68
-
Total Short Sales 76
-
Total NOD/Foreclosures 42
-
Total Homes Priced $750K or More 1,780
-
Total Homes Priced $300-$750K 5,911
-
Total Homes Priced $300K or Less 1,794
-
Total Expired in the Last 30 Days 1,285
-
Total Sold in the Last 30 Days 1,883
-
Average Days On Market 44
-
Months Supply of Available Inventory 4.5
Decoding the Data: What This Means for Your Equity
Let’s keep it 100—when you see 934 price reductions in a single week, it’s easy to panic and think your home value is tanking. But here’s what the headlines won’t tell you: that’s not a market crash; that’s a market correction. Sellers who overshot the runway in December are finally coming back to reality so they can actually get moved.
If you’re a homeowner, your equity isn’t going anywhere—it’s just being challenged by a lot of new competition (1,087 new listings, to be exact!). To win right now, you can’t just ‘list’ and hope for the best. You need a vibe-check on your pricing and a strategy that makes your equity unshakeable. Whether you’re sitting in a luxury Hendo estate or a North Vegas starter, my job is to make sure you’re the one getting the ‘Closed’ sign while everyone else is just dropping their price. Don’t leave your net worth to chance—let’s look at your specific numbers.
Explore Home Buyer Tools
Explore Real-Time Market Reports
Explore Current Featured Homes
Stay Informed and Connected
Stay up-to-date with the latest trends in the Las Vegas housing market and be the first to know about new listings, price changes, and market insights that can help you make informed real estate decisions. Whether you’re buying, selling, or simply keeping an eye on the market, our data-driven updates and market reports will keep you ahead of the curve. Don’t miss out on valuable insights—subscribe to our weekly events newsletter and get both real estate updates and the latest happenings in Las Vegas delivered right to your inbox!
