
Vegas Housing Shift: Price Drops Hit 1,400+
Mid-September is bringing a noticeable pivot to the Las Vegas housing market. If you’ve been watching the headlines expecting a sudden crash or a sharp spike, the actual data tells a much more strategic story: inventory is building, giving buyers real choices while asking sellers to sharpen their pencils.
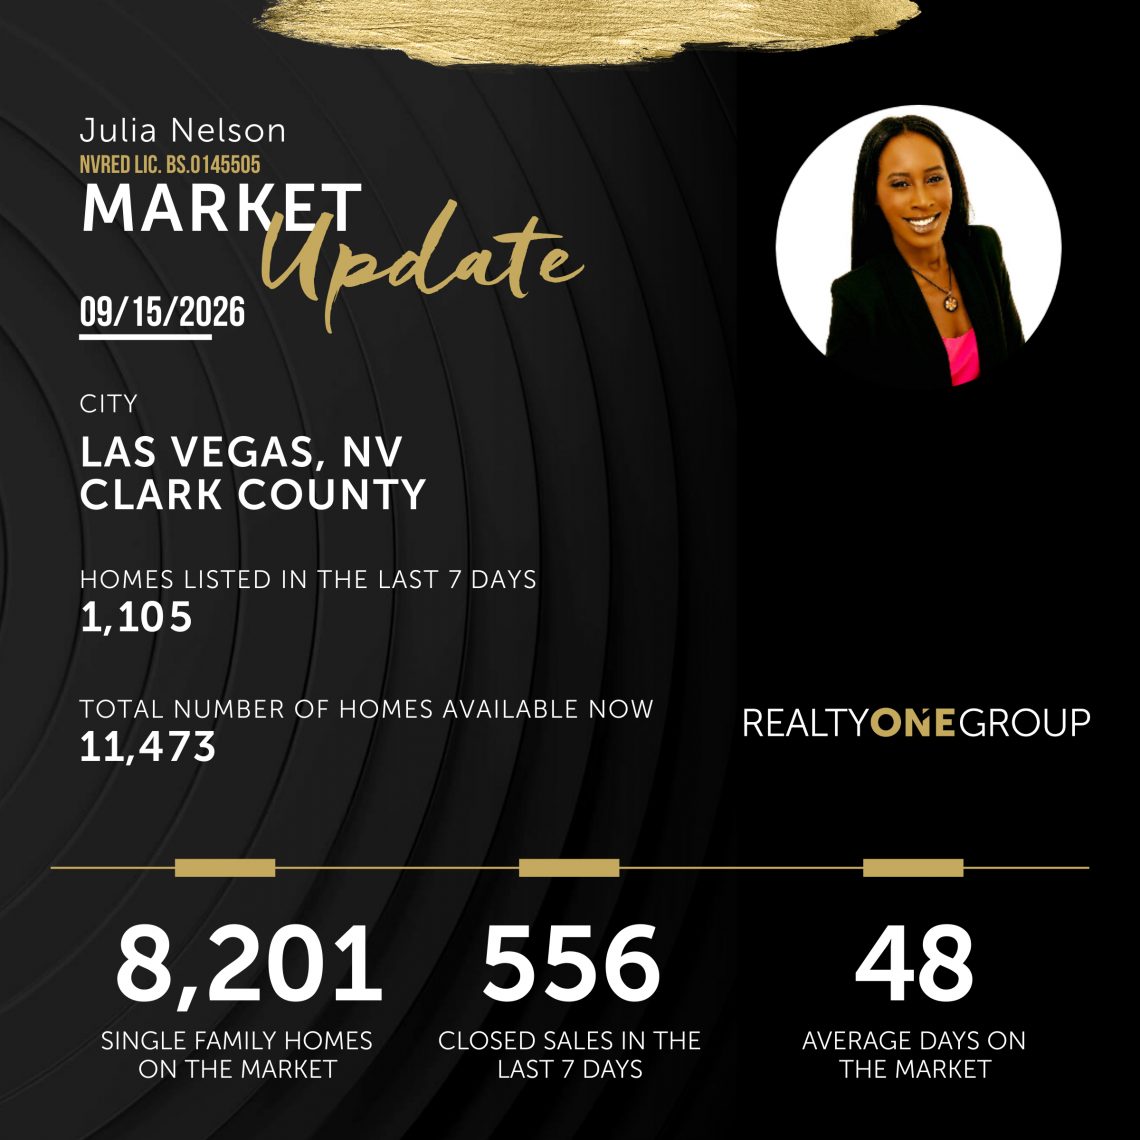
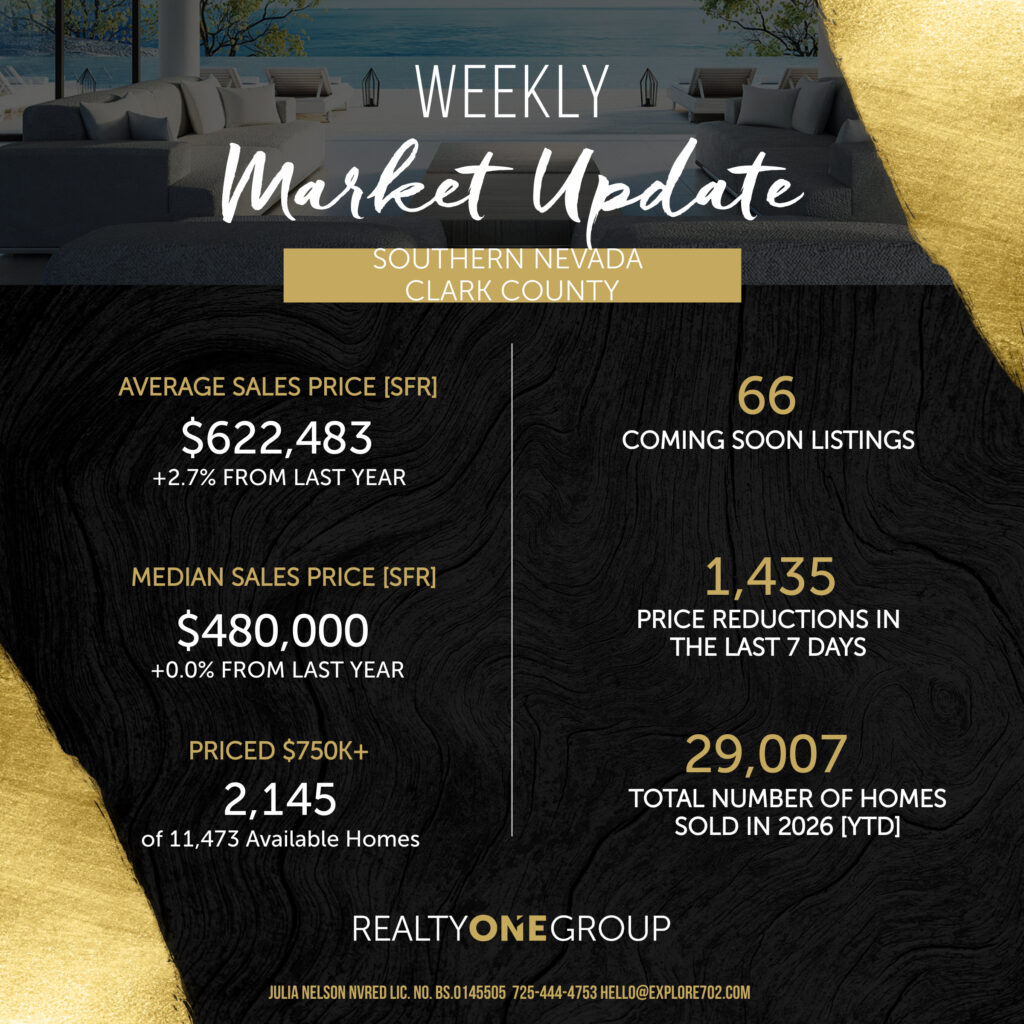
Right now, Clark County active supply has expanded to 11,473 total available properties, with single-family homes making up 8,201 of those listings. But the biggest driver in this week’s activity is pricing—1,435 price reductions went live in just the last seven days as sellers adjust to meet today’s educated buyers.
Key callouts from this week’s metrics:
For Buyers: Supply is stretching out to 4.9 months, pushing closer to a balanced market territory. With homes sitting for an average of 48 days, you have the leverage to negotiate closing cost credits, inspection repairs, and interest rate buydowns.
For Sellers: The average sales price for single-family homes is holding at $622,483 (+2.7% year-over-year), while the median sits steady at $480,000. Turnkey homes priced accurately right out of the gate are still moving, but overpricing leads directly to sitting on the market.
Let’s break down the exact numbers behind this week’s numbers so you can map out your next move with total clarity. 👇
RESIDENTIAL AVERAGE PRICE
Rolling 12-month period, along with percentage increase or decrease from the previous year.-
$605,979 Last Year
-
+2.7% Increase
RESIDENTIAL HOMES SOLD
Rolling 12-month period, along with percentage increase or decrease from the previous year.-
31,393 Last Year
-
-2.3% Decrease
RESIDENTIAL MEDIAN PRICE
Rolling 12-month period, along with percentage increase or decrease from the previous year.-
$480,000 Last Year
-
+0.0% Increase
CURRENT NUMBER OF
RESIDENTIAL OFFERINGS AVAILABLE NOW
-
Las Vegas Single Family Residences 5,013
-
Henderson Single Family Residences 1,695
-
North Las Vegas Single Family Residences 813
-
Condos 1,587
-
Townhomes 1,311
-
Manufactured Homes 374
-
Coming Soon Listings 66
-
Total Under Contract 2,681
-
Total REO/Bank Owned 73
-
Total Short Sales 158
-
Total NOD/Foreclosures 47
-
Total Homes Priced $750K or More 2,145
-
Total Homes Priced $300-$750K 7,270
-
Total Homes Priced $300K or Less 2,122
-
Total Expired in the Last 30 Days 680
-
Total Sold in the Last 30 Days 2,238
-
Average Days On Market 48
-
Months Supply of Available Inventory 4.9
What That 4.9-Month Supply Means for You
Seeing 1,435 price cuts alongside 556 closed sales in a single week proves that buyers are out here taking their time and doing the math. With 2,681 properties sitting under contract right now, deals are getting done—just on much better terms for buyers than earlier this year.
Pushing up to a 4.9-month supply means the market isn’t rushing anybody anymore. Success right now comes down to game plan: buyers need to turn this inventory growth into long-term equity, and sellers need pricing precision so they don’t get stuck sitting on the market for 48+ days.
Whether you’re planning a fall move or just keeping an eye on your home’s equity, you don’t have to figure it out alone. Want to know how this 4.9-month supply impacts your specific neighborhood? Tap the button below to text me directly, and let’s talk through your options! ✨📲
Explore Real-Time Market Reports
Explore Current Featured Homes
Explore Home Buyer Tools
Stay Informed and Connected
Stay up-to-date with the latest trends in the Las Vegas housing market and be the first to know about new listings, price changes, and market insights that can help you make informed real estate decisions. Whether you’re buying, selling, or simply keeping an eye on the market, our data-driven updates and market reports will keep you ahead of the curve. Don’t miss out on valuable insights—subscribe to our weekly events newsletter and get both real estate updates and the latest happenings in Las Vegas delivered right to your inbox!
